When reporting issues against the JumpCloud Admin or User Portal, it is often beneficial to reproduce the behavior and capture the Network Activity Log from the associated browser Developer Tools. In this article, documented steps will be provided to enable this capture capability from the Chrome browser, but similar capabilities are available within other supported browsers if browser specific data is requested for diagnostic purposes.
The following steps will allow you to capture a HAR (HTTP Archive) file using the browser based Developer Tools. After the steps to reproduce the behavior have been completed and the file exported, provide this file to your JumpCloud Support Request for analysis. If requested by Support, a Zoom screen share may be arranged to record the actions taken and capture the associated Network Activity Log to a HAR file.
Use caution when sending HAR files, as they may contain sensitive information. JumpCloud recommends these best practices when handling HAR files:
- Review the contents of HAR files before sending them to JumpCloud Support.
- Enlist your internal security team to review the contents of HAR files before sending them externally.
JumpCloud is committed to data sanitization, including the removal of sensitive data from HAR files before they are accessed by our Support team, including:
- Request/response headers
- POST data
- Session cookies
- Response content
Activate Developer Tools for Capturing Network Activity Logging
- From Chrome’s View menu, select Developer > Developer Tools. Alternately, use the following keyboard shortcuts:
- Mac: Command + Option + I
- Windows, Linux, Chrome: Control + Shift + I
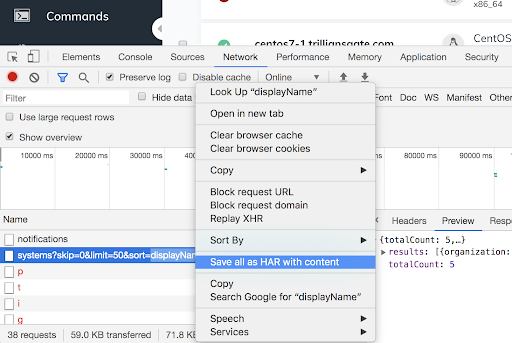
- With Developer Tools open, confirm that the following options are enabled to view and capture actions executed in the browser and the results of the associated web api calls. Select the Network tab and verify that the Preserve log option is enabled.
- The Record button will be enabled and will be red. You can toggle it to stop and start recording network activity. If necessary, use the icon to the right of the record button to clear any unwanted data before reproducing the actions in the WebUI to be captured to a file.
- With the Preserve log option enabled, multiple web api calls can be traced to show the actions taken by customers and the associated results saved for diagnostic review by Engineering.
- To export the Network Activity Log file that will be in HAR format, right-click any of the web api calls in the Name section below the toolbar. This will highlight the action and allow the entire log to be saved to a file for submission to Engineering via Support.
Video: Using DevTools for Capturing Network Activity Logging
Watch this video to see how to use DevTools to capture network activity logs.
Set Up DevTools to Capture SAML Data for Troubleshooting
Without installing a Chrome extension, you can rely on the method above to capture all SAML related communications via the Network inspection tab. As SAML typically triggers a new browser window, enabling Auto-open DevTools for popups under Settings > Preferences > DevTools is required.


Additionally, there are Chrome extensions that can be installed in the browser that will add SAML tabs to the Debugger Tools. This will isolate and display SAML related network traffic including response and request data in an easily readable format. As noted above, enabling the Auto-open DevTools for popups option along with the Preserve log option will be required to prepare for capturing SAML network traffic for further analysis.

Each of these tools may also provide additional functionality to easily collect and analyze SAML data. See the associated Chrome extension documentation linked below for details.


